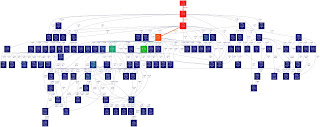
Use the following procedure to visualise the logic through xfoil:
- Make sure you have the correct dependencies
- gprof (or one of the alternative profilers installed).
- Make sure you have graphviz
- Download gprof2dot.py
- Make sure that you can compile xfoil properly
- Modify the flags in the Makefile (${srcdir}/Xfoil/bin/Makefile) to allow the profiling of the xfoil code.
- Add the -pg option to the FFLAGS and FFLOPT makefile variables.
- Add the -pg option to the make xfoil command line (" xfoil: $(XFOILOBJ) $(XUTILOBJ)... $(FC) -o xfoil $(XFOILOBJ) .... -pg"
- Note it may be necessary to do a "make clean" to be able to recompile xfoil.
- Now create a script file that touches all the xfoil commands that your interested in.
- Example below does an viscous, (slightly) compressible analysis analysis of a NACA 23012 airfoil section at 10 degrees AoA.
- Now run the script.
- ~/bin/xfoil < naca23012.xfoilscript
- Note that I have a bin directory in my home folder (~) that has a symbolic link to the particular xfoil program I want to run. Hence ~/bin/xfoil command.
- If you've compiled xfoil correctly you'll get profiler file (gmon.out for gprof) file in the same directory that you ran the xfoil script in.
- Now run the gprof2dot script to generate a dot file.
- gprof ~/bin/xfoil | ./gprof2dot.py -n0 -e0 | dot -Tpng -o xfoil.png
- Enjoy the call graph
 |
| Xfoil call graph for the example script |
Xfoil Script
$ cat naca23012.xfoilscript
plop
g


naca
23012

oper
v
3e5
m
0.3
a
10


quit

No comments:
Post a Comment